TABLE OF CONTENTS
DA-201
Sprint summary
Getting Started
Topic 1: What-If Analysis
- What if analysis
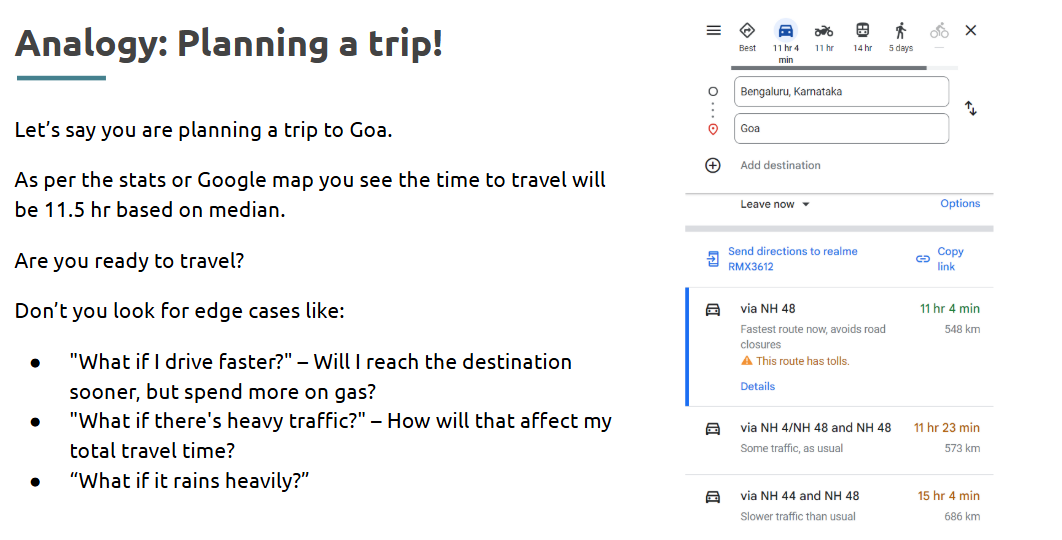
Understanding different possibilities and planning for the unknown is critical in data-driven decision-making. That’s where What If Analysis becomes a powerful tool.
What is it?
What If Analysis allows analysts to model different scenarios and evaluate the outcomes by changing input variables without altering the actual data.
Where is it used?
Used in budgeting, forecasting, sensitivity analysis, and decision modeling in tools like Excel, Power BI, and financial modeling platforms.
How is it used?
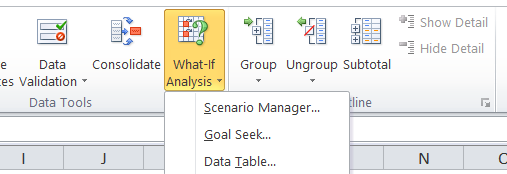
Excel also helps us to look into such scenarios using the in-built what-if analysis feature. With What-If Analysis, you try out different possible scenarios and see how they affect your outcomes. It helps you prepare for different situations so you’re not surprised by what happens.
Note: This feature is not present in Excel online free version. |
Types of What-if Analysis
Three types: Goal Seek Scenario Manager Data table
| 
|
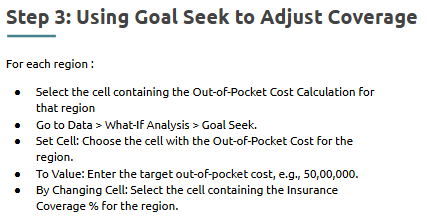
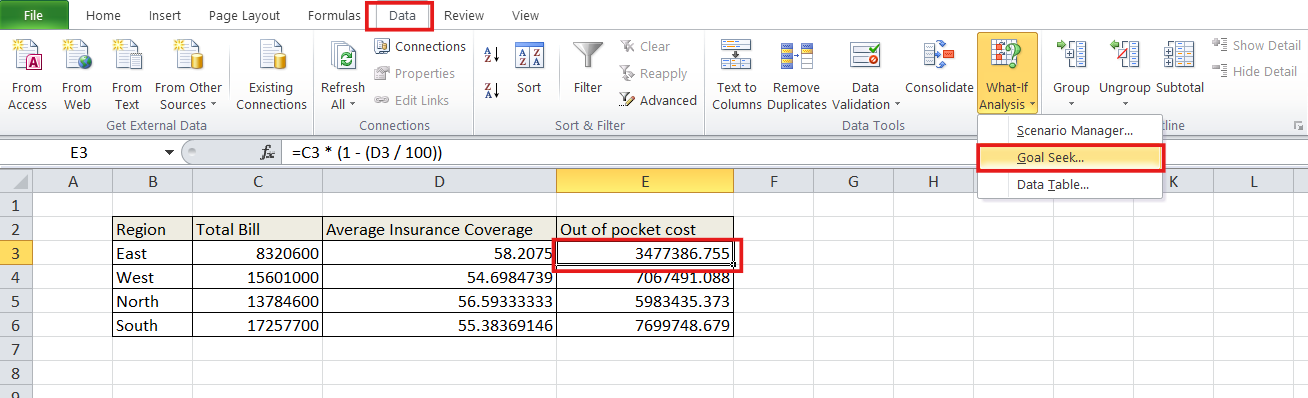
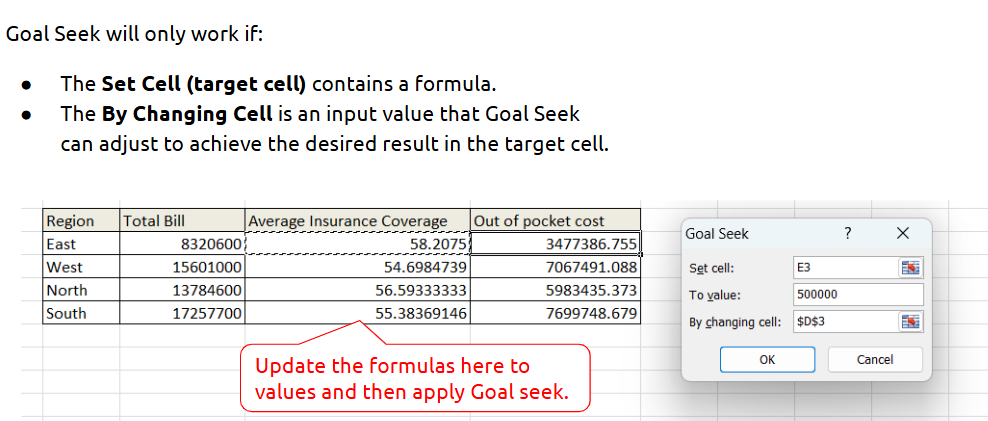
Goal Seek:
Goal Seek is a tool that helps you find the right input to achieve a specific target.
Example: Goal Seek Analysis by Region for Insurance Coverage
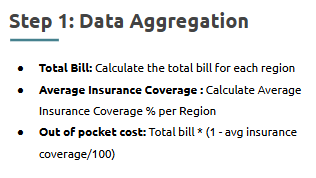
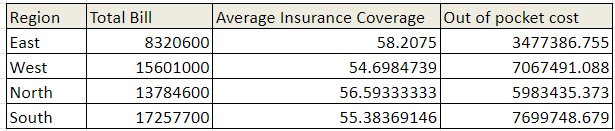
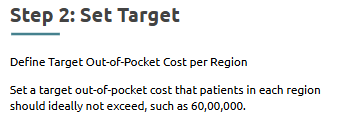
Goal: Determine the insurance coverage needed in each region to keep the total amount that patients pay out-of-pocket below a set limit. Example: What insurance coverage percentage is required in each region to ensure out-of-pocket expenses stay below $100,000? |
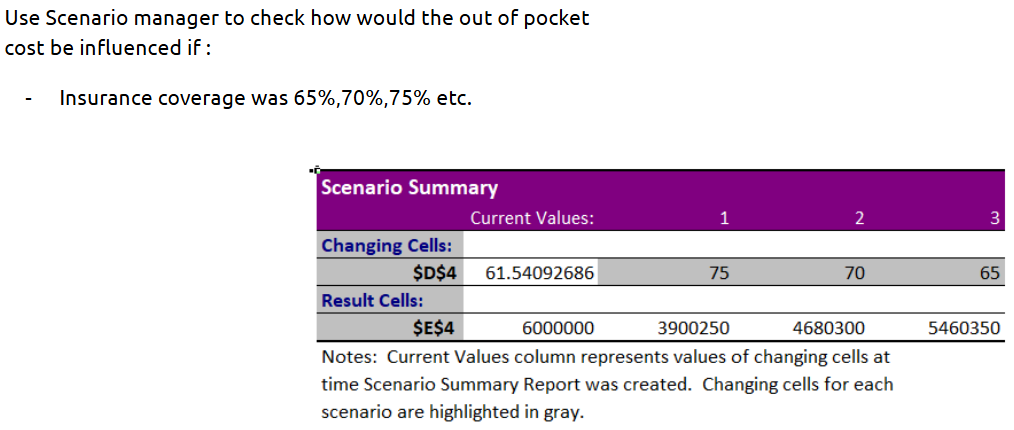
Scenario Manager:
Allows you to create and compare multiple “what-if” scenarios
.
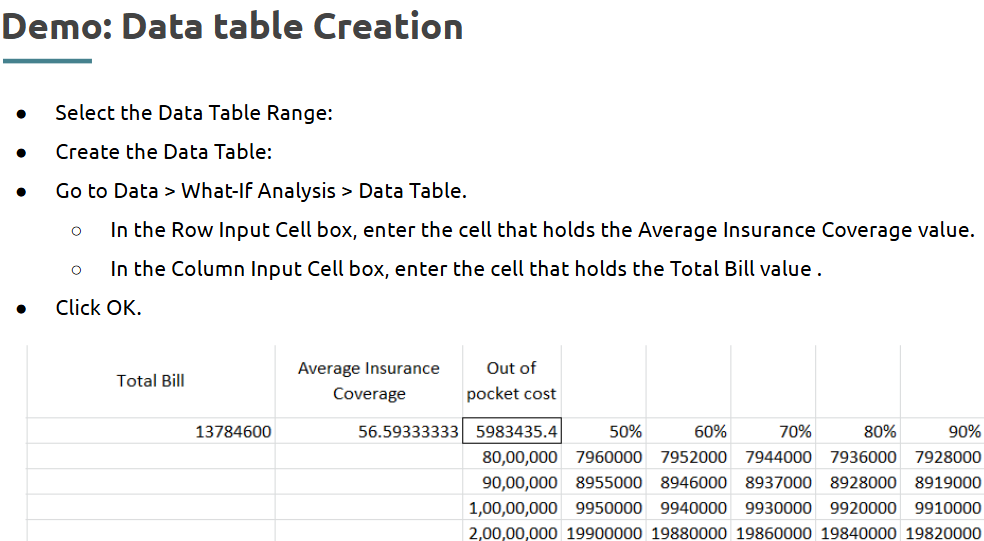
Data Table:
Data Tables allow you to see how changes in one or two variables affect your results across a range of scenarios.
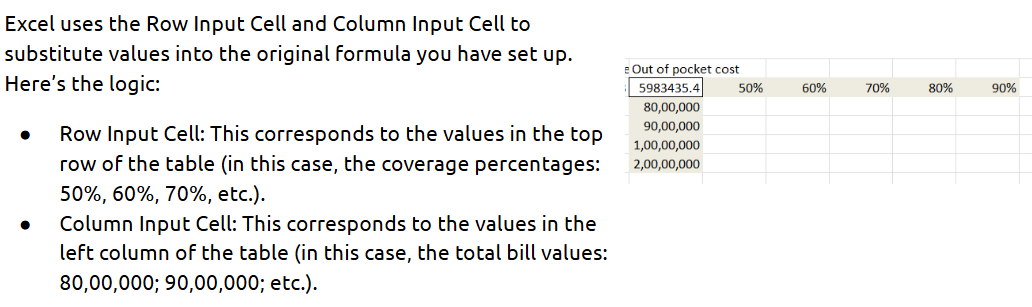
How the Data Table Works:
Data Table VS Scenario Manager
Data table:
Scenario Manager:
|
--- Takeaways / Best Practices
• Always validate scenarios with domain knowledge
• Limit parameter ranges to realistic values
• Use slicers for interactivity in dashboards
Topic 2: Window Functions in SQL
- Window functions
When dealing with large datasets and needing to perform calculations across a set of rows related to the current row — Window Functions are your go-to SQL powerhouse.
What is it?
Window Functions perform calculations across a set of table rows that are somehow related to the current row, without collapsing the result set like GROUP BY does.
A window function allows us to perform calculations across a specific set of rows related to the current row. calculations happen within a defined window of data useful for aggregates, rankings, and cumulative totals without altering the dataset. The OVER clause is key to defining this window.
|
Where is it used?
Used in SQL queries for ranking, running totals, moving averages, and comparisons across partitions in databases like PostgreSQL, MySQL, SQL Server, etc.
How is it used?
Syntax:
SELECT column_name1, window_function(column_name2) OVER([ORDER BY column_name3]) AS new_column FROM table_name; |
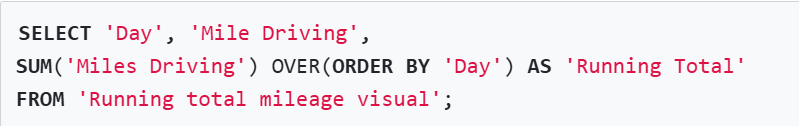
How window functions work? - Example
Partition By Clause:
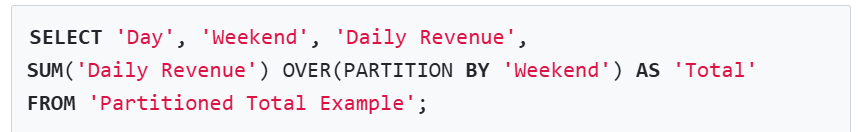
The PARTITION BY clause is an extension of the OVER() clause that divides the result set into logical partitions, allowing you to isolate calculations within each partition without collapsing the original rows.
Syntax: <window_function>(<expression>) OVER (PARTITION BY <column> ORDER BY <column>) |
|
Working of Partition by Clause:
--- Takeaways / Best Practices
• Window functions don’t reduce the row count — ideal for detailed analytics
• Use partitions carefully to isolate group-wise calculations
• Essential for leaderboard creation, time-based comparisons, and retention analysis
-SQL Rank Function
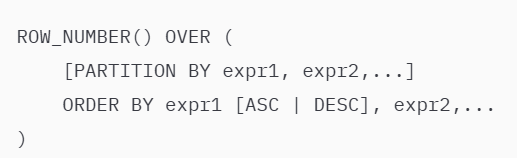
1. ROW_NUMBER():
The ROW_NUMBER() function is perfect when you need to uniquely rank rows within a result set, providing a simple, efficient way to add row numbers. Syntax:
|
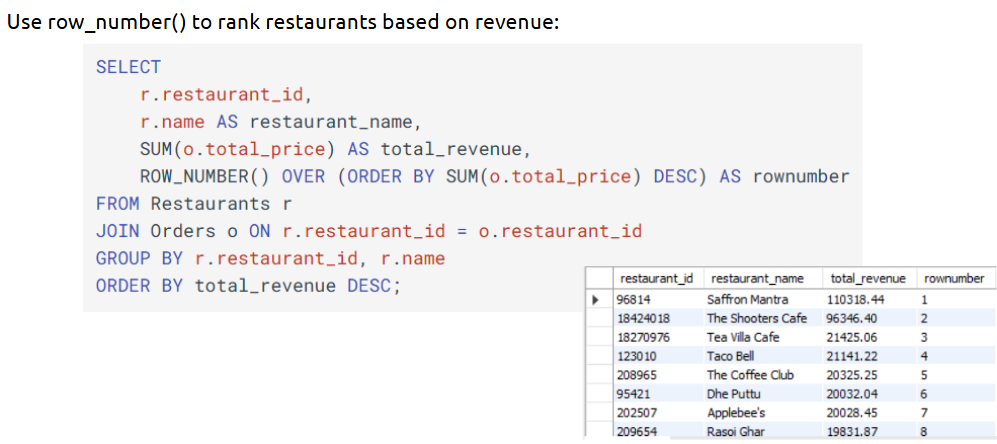
Example:
2.RANK():
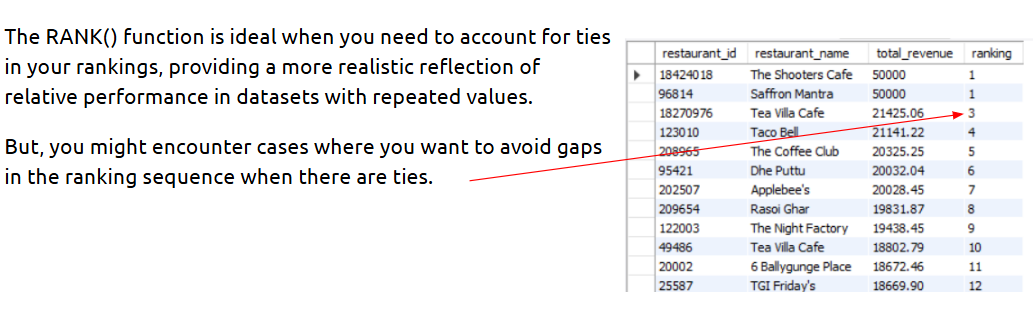
RANK() is a ranking function that assigns ranks to rows within a partition of a result set. It allows ties by giving multiple rows the same rank if they have the same value in the ORDER BY clause.
Syntax RANK() OVER ([PARTITION BY <column>] ORDER BY <column>) |
|
Example:
Let’s rank the restaurants by total revenue, this time allowing for ties:
SELECT r.restaurant_id, r.name AS restaurant_name, CASE WHEN r.restaurant_id IN (96814, 18424018) THEN 50000 -- Force a tie for testing ELSE SUM(o.total_price) END AS total_revenue, RANK() OVER (ORDER BY CASE WHEN r.restaurant_id IN (96814, 18424018) THEN 50000 -- Same total for testing ELSE SUM(o.total_price) END DESC ) AS rownumber FROM Restaurants r JOIN Orders o ON r.restaurant_id = o.restaurant_id GROUP BY r.restaurant_id, r.name ORDER BY total_revenue DESC;
|
|
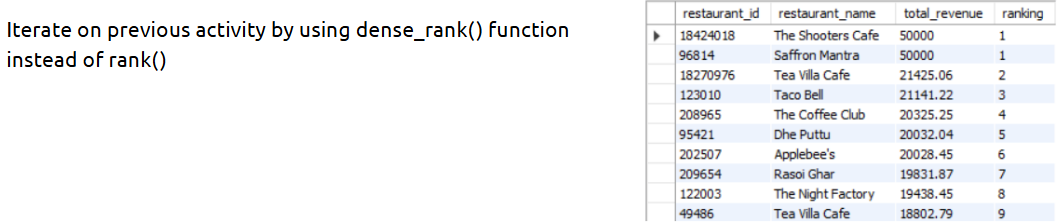
3.DENSE_RANK():
DENSE_RANK() is a ranking function similar to RANK(), but it does not leave gaps in the ranking sequence when there are ties. It is ideal when you want a continuous ranking order, even when multiple rows share the same rank.
Syntax: DENSE_RANK() OVER ([PARTITION BY <column>] ORDER BY <column>) |
|
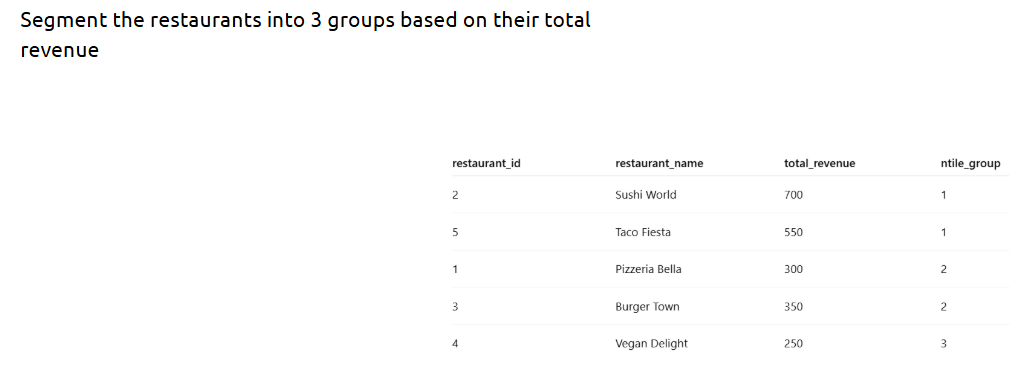
4.NTILE():
NTILE() is a ranking function that distributes rows into a specified number of roughly equal groups, called tiles or buckets. It is particularly useful for percentile calculations and cohort analysis.
Syntax NTILE(<number_of_groups>) OVER ([PARTITION BY <column>] ORDER BY <column>) |
|
Topic 3: Working with CTEs and Introduction to Real-World Projects
- CTEs
A CTE is a temporary, named result set defined within a SQL query that can be referenced like a table.
Where is it used?
CTEs are used in SQL for simplifying complex joins and subqueries, improving code readability, and enabling recursive queries.
A CTE (Common Table Expression) is a temporary result set in SQL that you can reference within a SELECT, INSERT, UPDATE, or DELETE statement.
CTEs are often used to simplify complex joins, improve code readability, and enhance query performance.
|
How is it used?
• Start with a WITH clause followed by the CTE name and query.
• Reference the CTE in the main query like a regular table.
• Useful in breaking down multi-step logic (e.g., filtering before aggregation).
Syntax:
Simple CTE: WITH cte_name AS ( SELECT ... ) SELECT * FROM cte_name; | Chaining Multiple CTE: WITH first_cte AS ( SELECT ... ), second_cte AS ( SELECT ... FROM first_cte ) SELECT * FROM second_cte |
Example:
Improve the query we wrote earlier using CTEs to make it scalable and reusable:
https://www.crio.do/learn/PSDS/ME_SQL_CTE/ME_SQL_CTE_MODULE_CTEISQL/
Subqueries VS CTEs
Aspect | Subqueries | CTEs |
Readability | Harder with nested levels | Easier to read and modular |
Reusability | Not reusable | CTEs can be referenced multiple times |
Debuggability | Difficult | Easier to debug each CTE block |
Performance | May be faster for simple cases | Comparable; may optimize better for complex logic |
Use Case Suitability | Best for simple, one-off operations | Best for layered, complex logic |
--- Takeaways / Best Practices
• Use CTEs to make queries easier to maintain and understand.
• Name CTEs clearly to reflect their purpose.
• Combine multiple CTEs for layered logic without nesting.
-Mini Project(Coke-Sales Analysis)
-Problem Statement:
We want to Analyze the factors affecting sales. For example: Month with lowest and highest sales? How sales vary across regions? How sales vary for different brands? How sales vary for different brands and different months? How sales vary for different brands and different regions? How sales vary with different retailers? ….. etc
|
-Project Submission Guidelines
As a part of the project submissions, we are not limiting you to do the project in a certain way. You are free to do the project on your own and come up with your own analysis. Here are a few guidelines to submit your project. Video Demo of your Project Record a video presenting your project work. You can use any recording platforms like Loom or OBS Studio. You can also record the video in Zoom, download and submit it. Make sure the video length does not exceed 15 minutes. Video recording is supported on Crio Platform but you won’t be able to share screens. Upload the video in the video activity given.
Instructions for your project submission - Link Submit the GitHub repository link in the activity Follow this process to create a GitHub account, push the project and submit the repository link - Process document
|
Topic 4: Debrief and Creating a Reusable Analysis Template
- Template for analysis
How to attempt an analysis?
For the coke-sales analysis Don’t we need a template to synchronise our thought-process in a systematic way? |
Data Analysis Template:
? 1. Understanding Problem Statement
Clearly define the business or operational problem. What are we trying to understand, improve, or predict? Who are the stakeholders, and what decision(s) will this analysis support?
|
? 2. What Data Exists?
What data sources are available (databases, Excel, APIs)? What’s the granularity (daily, transactional, user-level)? Key tables, columns, and data types. Any known data limitations (missing data, outdated records)?
|
? 3. Data Points Related to the Problem Statement
What variables are likely to influence or explain the problem? Are there metrics/KPIs you should define (e.g., churn rate, conversion rate)? Data cleaning or preprocessing steps required?
|
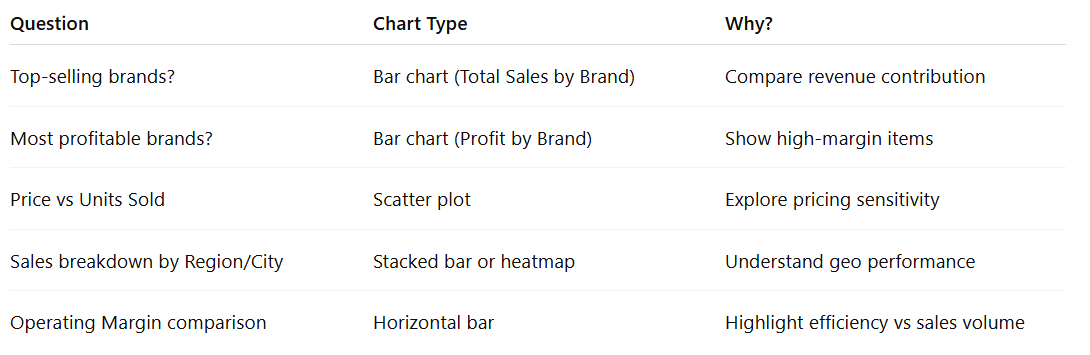
? 4. Analysis and Visualization
| Example
 |
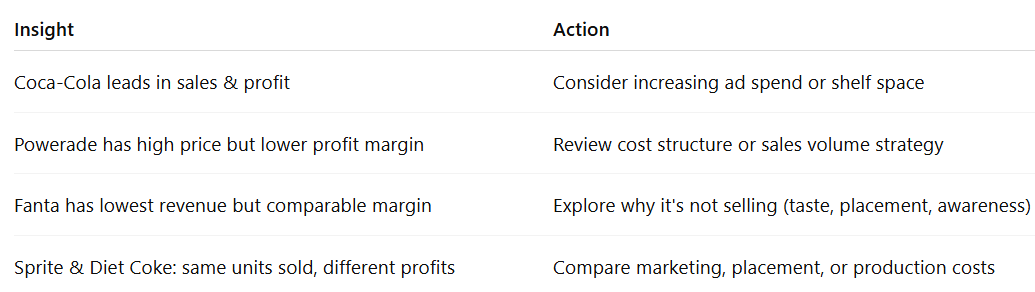
? 5. Insights & Next Steps
What are the actionable insights? What follow-up analysis are needed? What business actions can be taken?
| 
|
|
--- Takeaways / Best Practices
• Templates save time and reduce errors
• Keep them modular and easy to update
• Include both technical (code, queries) and communication (summary, insights) components
• Store them in shared repositories for team collaboration and version control
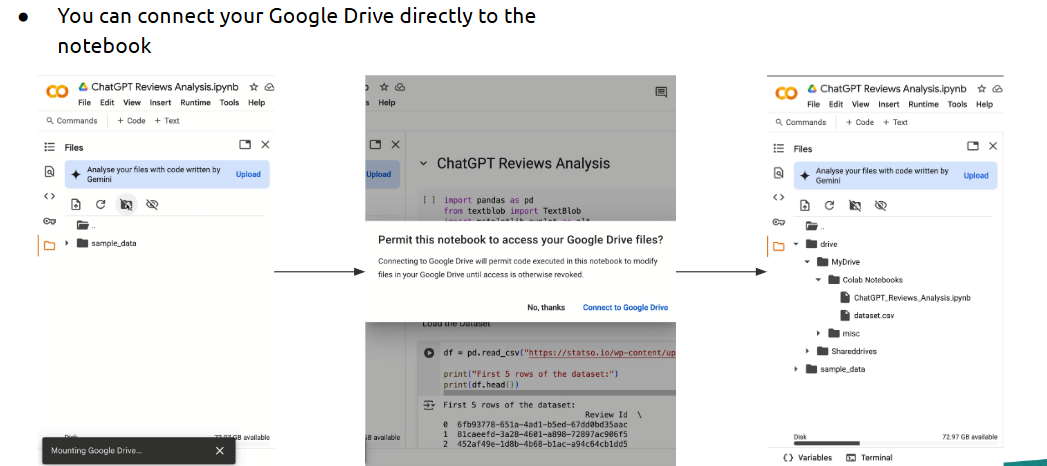
Topic 5: Project Setup and Execution Using Google Colab
- Using google colab
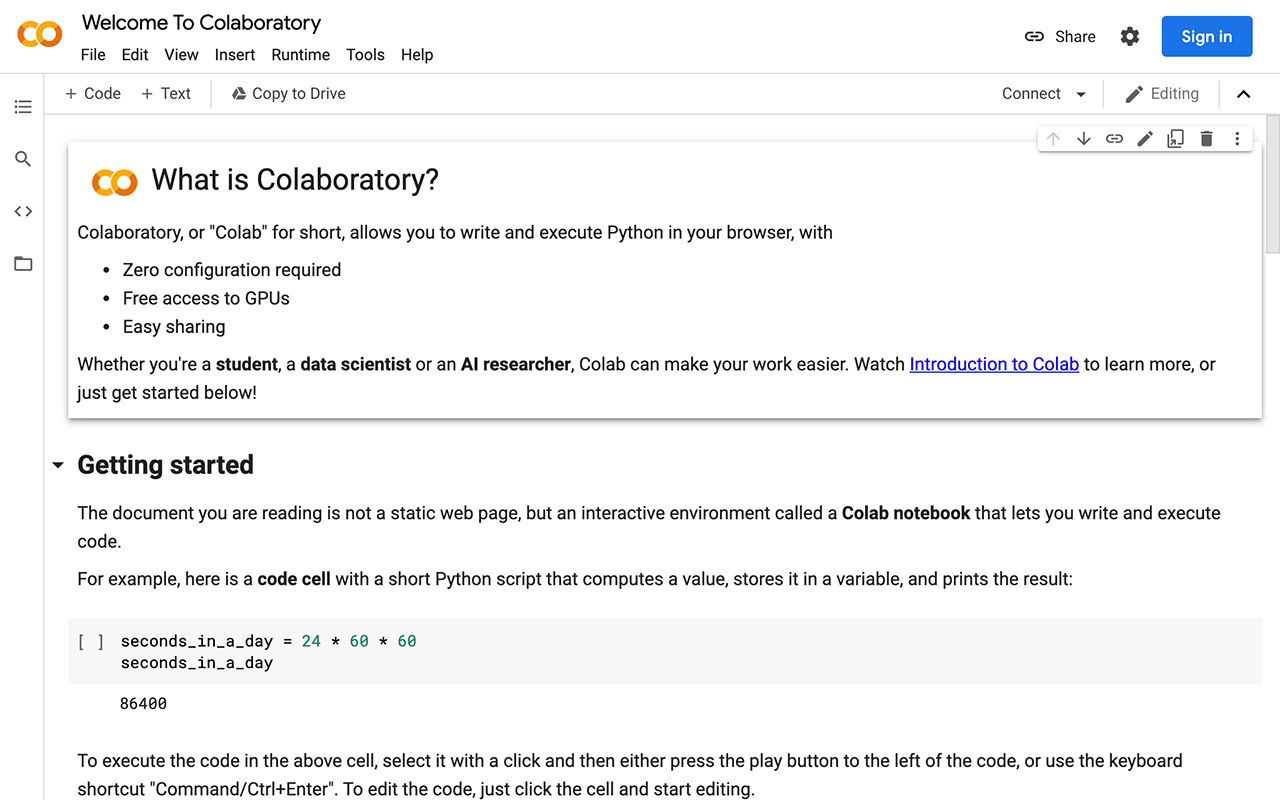
What is it?
Google Colab is a free, cloud-hosted Jupyter notebook environment provided by Google. Enables you to run Python code directly in the browser, no installation needed.
|
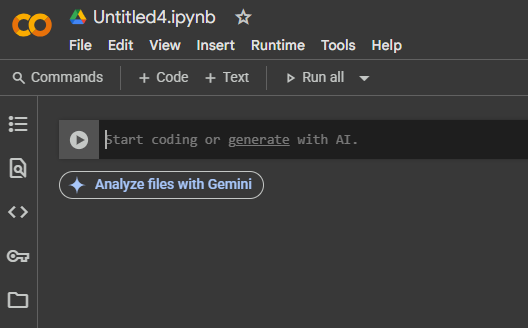
How is it used?
• Access at: https://colab.research.google.com
• Upload or connect to data via Google Drive or web URLs
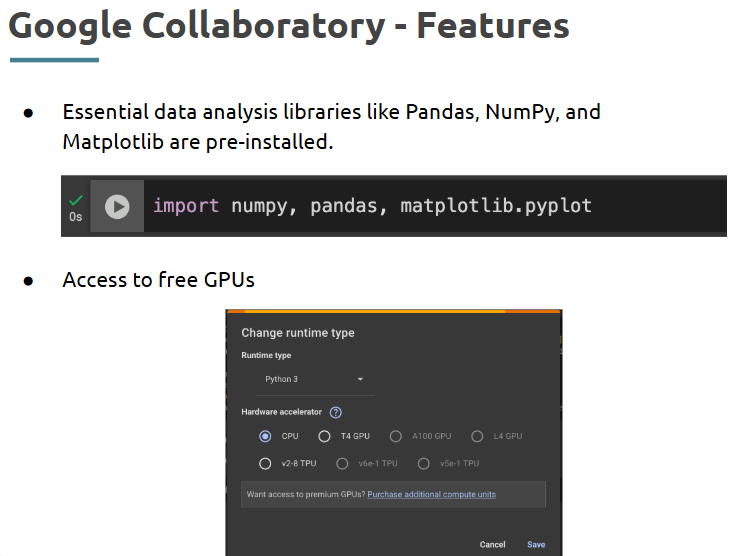
• Use Python and common libraries like Pandas, NumPy, Matplotlib
• Share notebooks with teams using Google Drive
• Run cells individually and use markdown for documentation
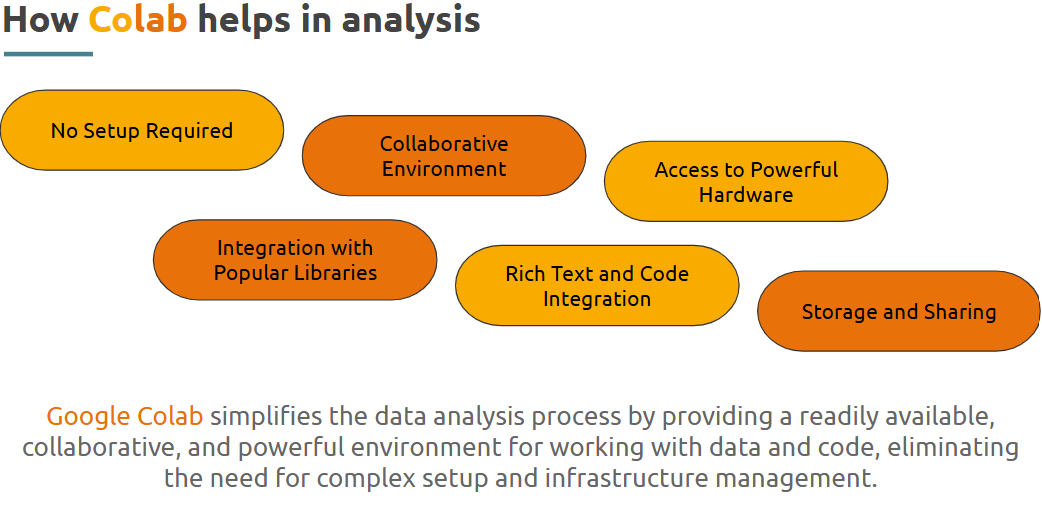
--- Takeaways / Best Practices
• No installation needed—ideal for quick collaboration
• Keep your code blocks modular and well-commented
• Use markdown cells to explain steps and findings
• Take advantage of built-in versioning through Drive for backups
Problem statement: ChatGPT Reviews
People have shared a wide range of feedback about ChatGPT through ratings and written reviews In this session, you’ll explore these reviews to understand what users love, what frustrates them, and what can be improved By analyzing sentiment, patterns over time, and common issues, we can learn how to make ChatGPT better.
|
Understanding the problem statement
The key objectives of this problem are: Identify positive, negative, and neutral user sentiments Detect common problems driving negative reviews Track how sentiment evolves over time |
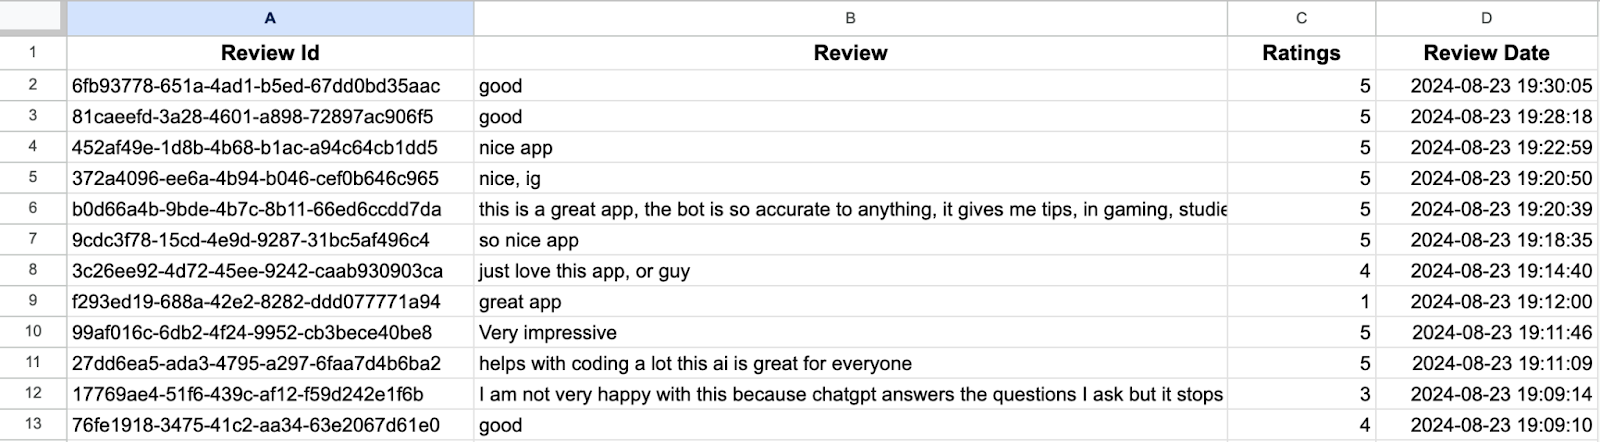
Exploring the dataset:
To download the dataset, head over to this link:
https://statso.io/wp-content/uploads/2024/08/chatgpt_reviews.csv
Exploring the Dataset
The dataset contains 4 fields: Review ID: A unique identifier for every review Review: Comments given by the user Rating: Represents the levels of satisfaction on a scale of 0-5 Review date: When the review was posted
|
Topic 6: Reading Dashboards and Debriefing Results
- Dashboard Reading
What is it?
Dashboard reading involves analyzing and drawing insights from visual data summaries created using tools like Power BI or Tableau.
Where is it used?
Used by business analysts, stakeholders, and decision-makers to monitor performance, identify trends, and take data-driven actions.
How is it used?
Dashboard : Transport Analytics
Steps:
1. Observe the Dashboard
What are the main charts, graphs, and visualizations? What KPIs (Key Performance Indicators) are being displayed? (e.g., On-time Delivery Rate, Fuel Consumption, Inventory Levels, Shipment Volume). How is the data segmented or filtered? (e.g., by region, date, product, carrier). Are there any interactive elements ?
|
2. Make Inferences about the Data What kind of data would be needed to create this dashboard? (e.g., historical delivery records, vehicle telemetry data, warehouse inventory logs, customer order details). What data sources might be involved? (e.g., ERP systems, TMS, WMS, GPS tracking, sensor data). What's the granularity of the data? (e.g., daily, per shipment, per vehicle, per item).
|
3. Infer Business Questions & Insights What business questions is this dashboard trying to answer? (e.g., "Are we meeting our delivery SLAs?", "Which routes are most fuel-efficient?", "Do we have too much stock of a particular item?", "Which suppliers are performing best?"). What immediate insights can you draw from the current state of the dashboard? (e.g., "On-time delivery dropped significantly last month," "Warehouse B has consistently higher picking errors," "Fuel costs are rising in the North region"). How might a logistics manager use this dashboard to make decisions?
|
4. Identify Potential Improvements/Next Steps What other KPIs or visualizations would you add to make this dashboard more useful? What questions does the dashboard raise that aren't answered? If you had access to the data, what deeper analysis would you perform?
|
--- Takeaways / Best Practices
• Always check for filters/slicers that affect what you're viewing
• Focus on high-impact visuals first (KPIs, summaries)
• Context is everything—understand what each metric means for the business
- project debrief
Dashboard #2 Supply chain Dashboard Repeat the steps for above dashboard: Observe the dashboard Make inferences about the data Infer business questions and insights Identify Potential Improvements/Next Steps
|
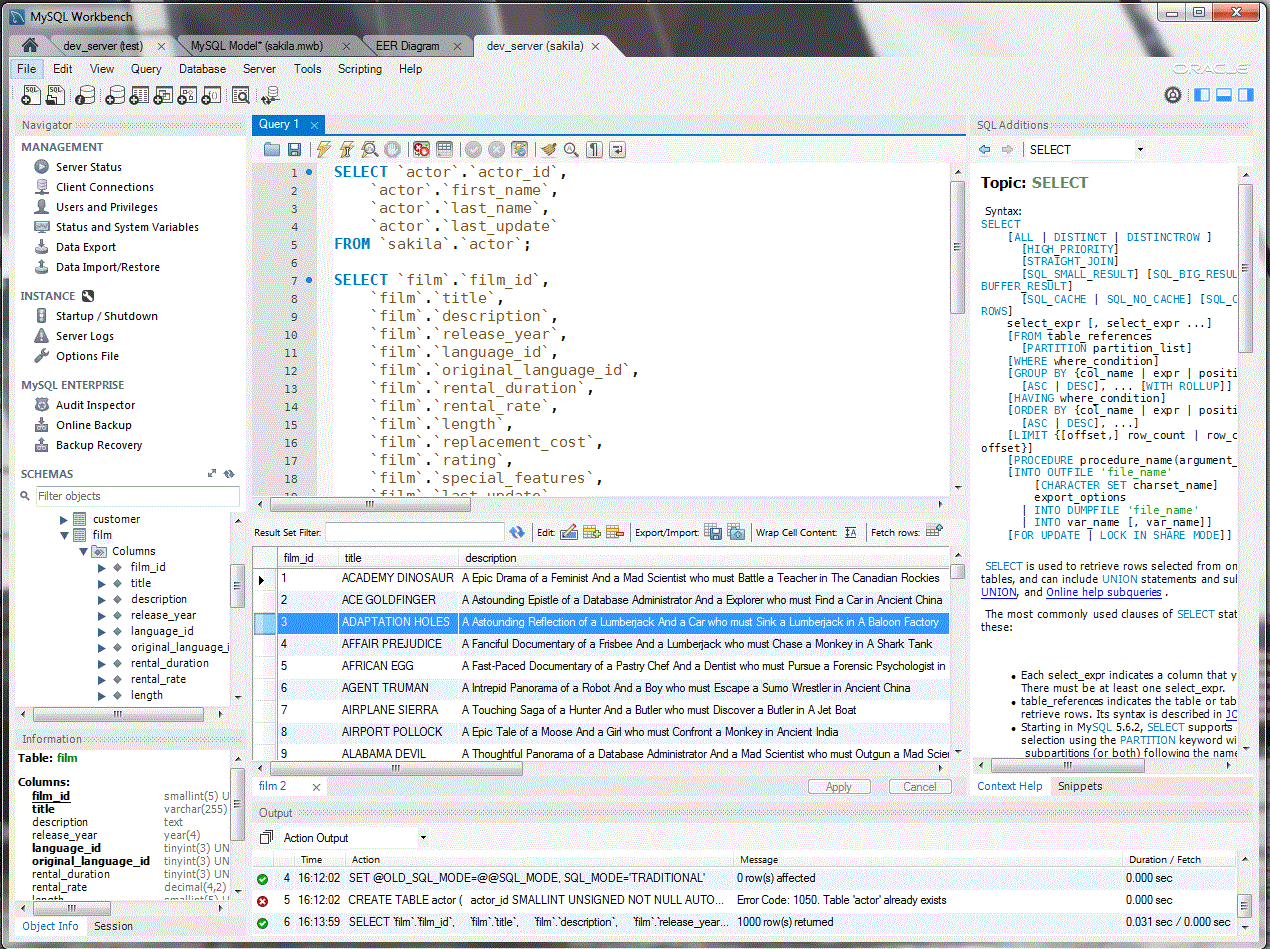
Topic 7: SQL Workbench
- SQL workbench
SQL Workbench is a lightweight SQL client that lets you connect to databases, write queries, and manage data interactively.
Where is it used?
Used by data analysts, developers, and DBAs to run SQL scripts, test queries, and visualize query output from various databases (PostgreSQL, MySQL, etc.)
How is it used?
Working on the dataset:
Run this SQL file in workbench to have zomato database with 1 lakh rows in place: |
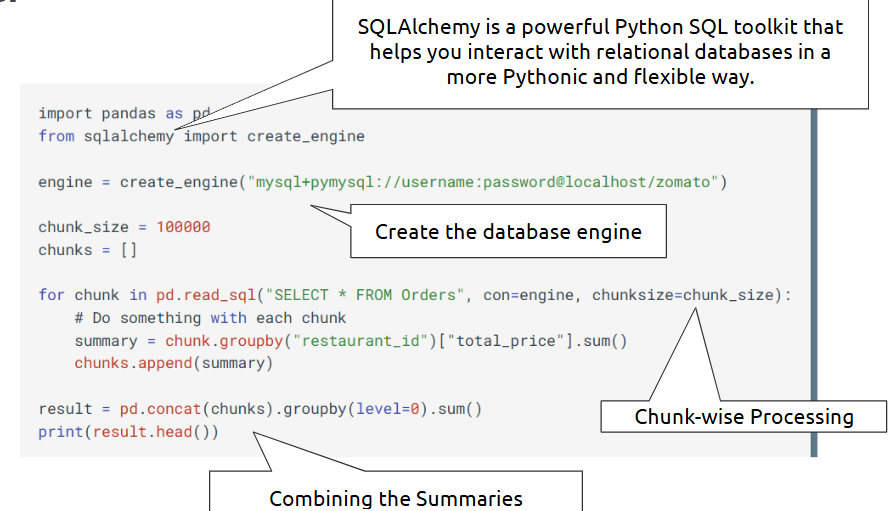
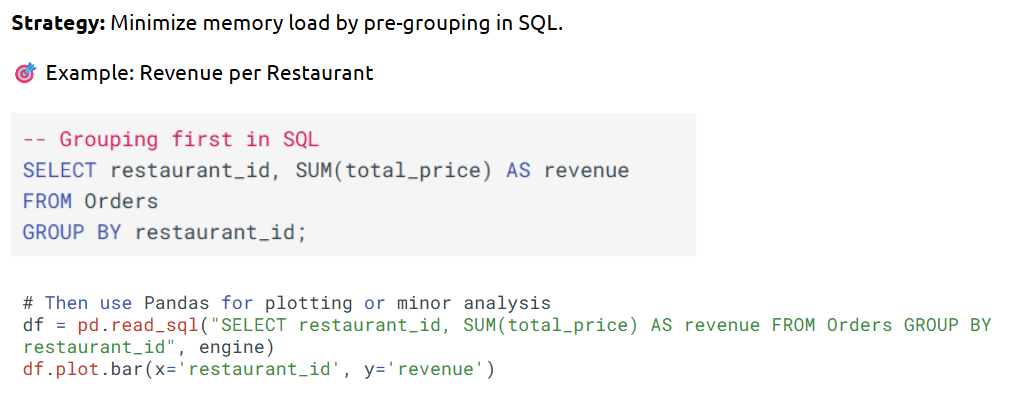
Reading Data in Chunks Using Pandas (Option 1)
SQL First, Pandas Second (Option 2)
--- Takeaways / Best Practices
• Always test queries on limited data before scaling
• Use aliases, formatting, and comments for readability
• Save frequently used queries as scripts or templates
• Verify connection settings before executing DML (INSERT/UPDATE/DELETE) commands
How will you handle data updates?
manually querying for updated data every day? Or is there some other way? |
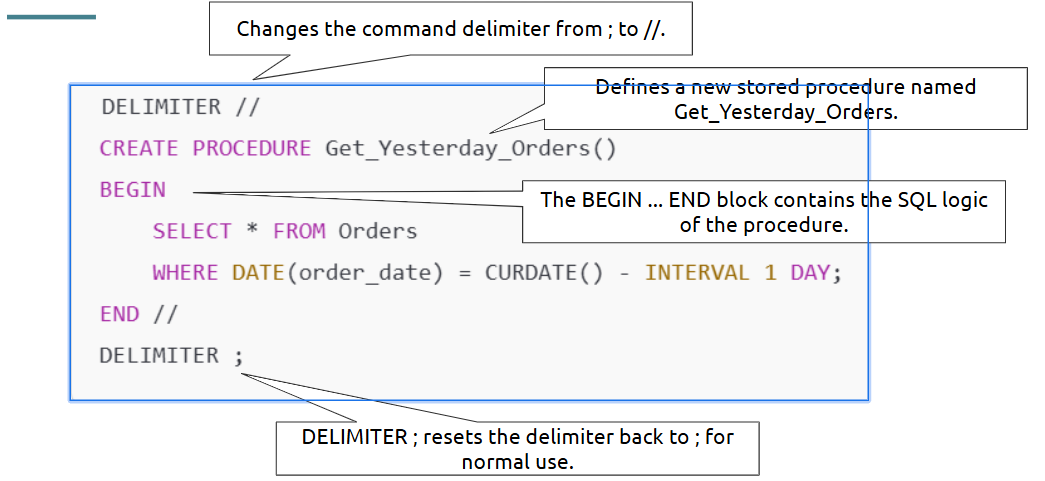
Stored Procedure
A stored procedure is a precompiled group of SQL statements stored in the database. You can execute it by calling it by name. It helps: Reuse code across applications. Encapsulate business logic. Improve performance for complex or repeated queries.
|
Instead of manually querying for updated data every day, you can create a stored procedure:
Then in Python:
pd.read_sql("CALL Get_Yesterday_Orders();", engine) |
|
Topic 8: Aptitude Building and Interview Preparation
- Aptitude Building
Why is Aptitude Building important for Data Analysts?
Problem-Solving Ability: Identify patterns, troubleshoot issues, and develop solutions from complex datasets. Logical Thinking: Interpreting trends, correlations, and anomalies in data. Adaptability to Tools and Methods: Quickly learn new tools, programming languages, or analytical techniques as technology evolves. Decision-Making Under Uncertainty: Make informed decisions even when data is incomplete, ambiguous, or conflicting.
|
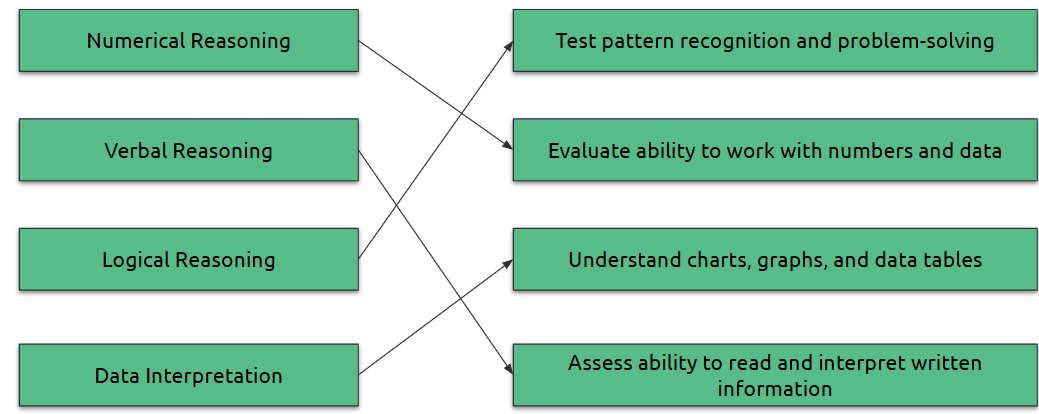
Categories of Aptitude tests:
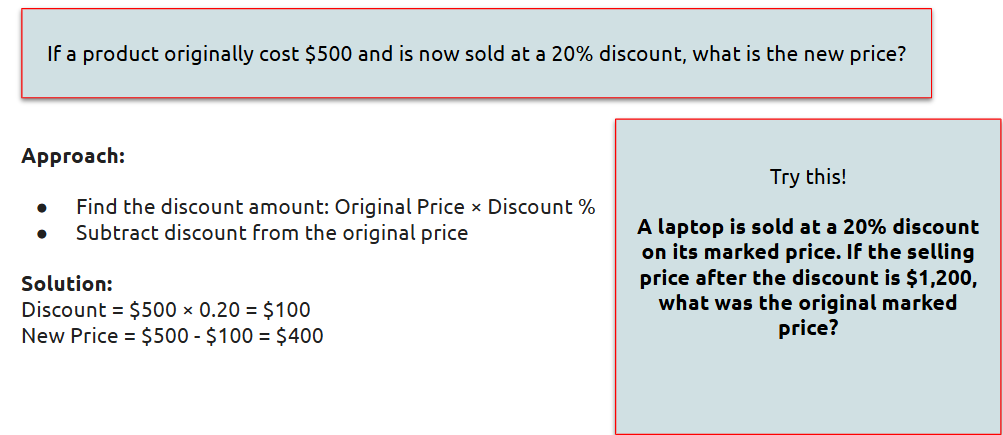
Numerical Aptitude:
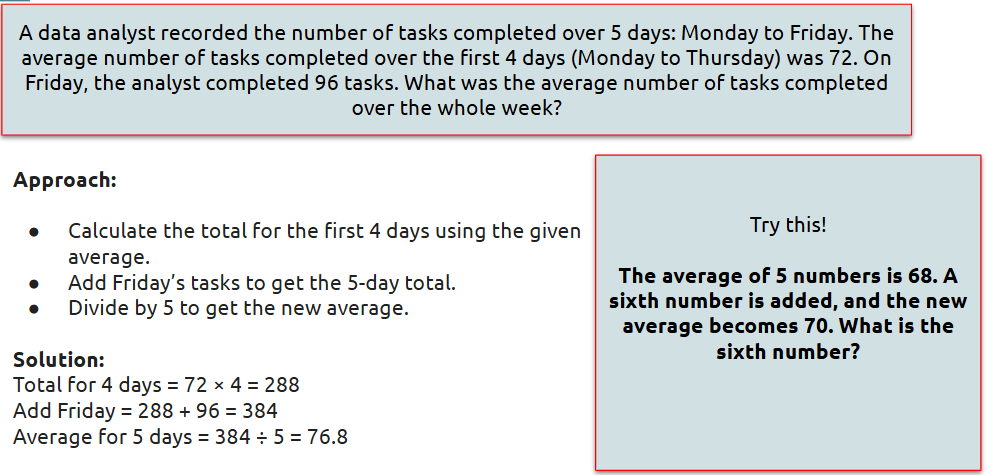
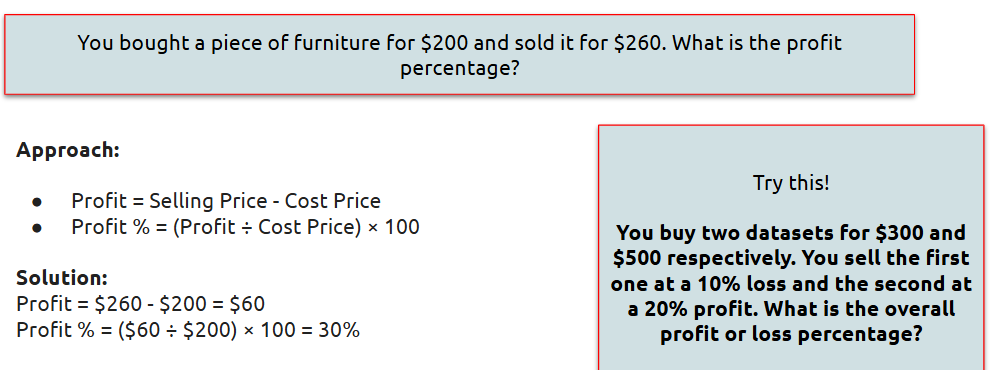
Solve percentage-based problems.
| Apply ratio and proportion concepts to quantitative problems. 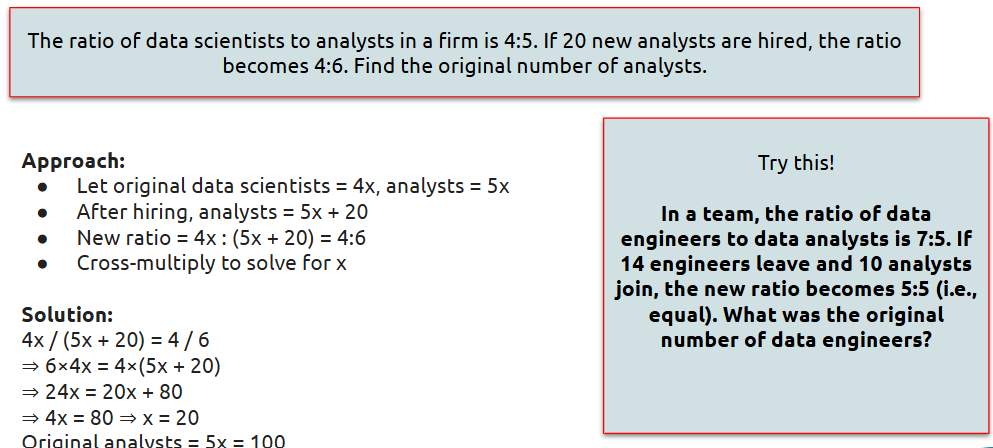
|
Calculate averages effectively.
| Analyze profit and loss scenarios.
|
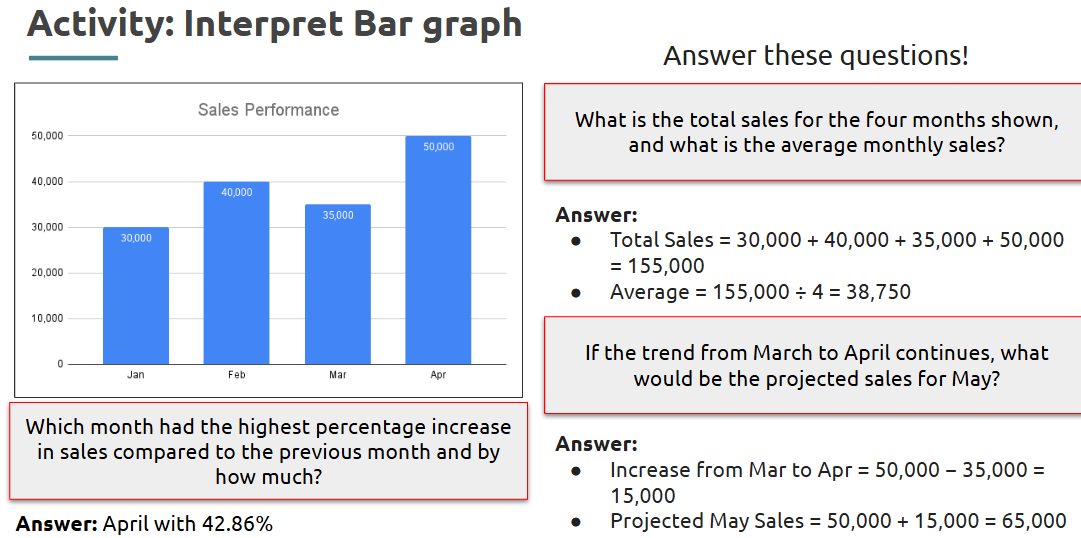
Data Interpretation:
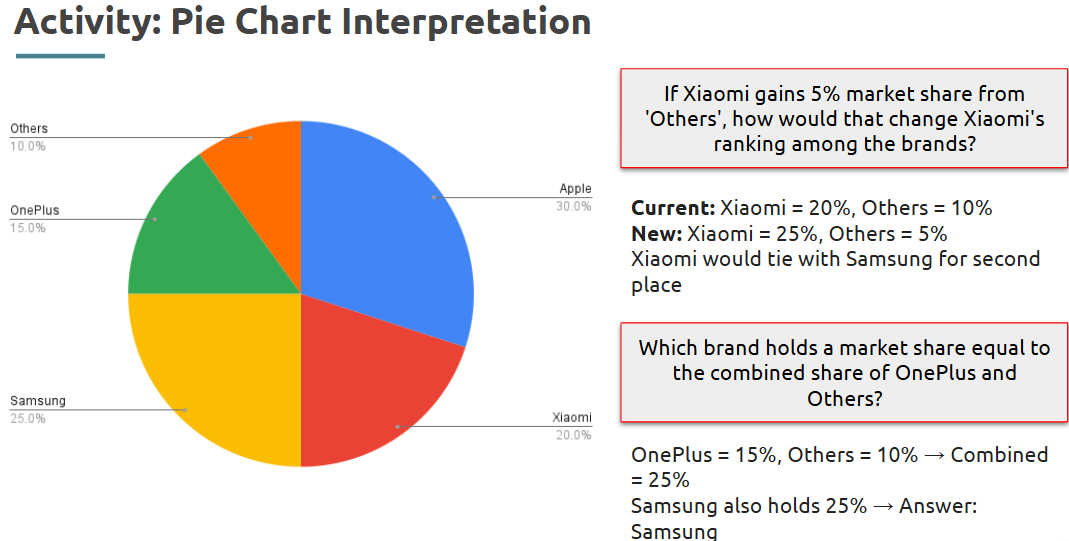
Visual data interpretation involves understanding and drawing conclusions from data represented graphically or in tables. This includes identifying patterns, comparing values, and recognizing trends in various formats like bar graphs, pie charts, tables, and line graph
Logical and Analytical Skills:
Number Series 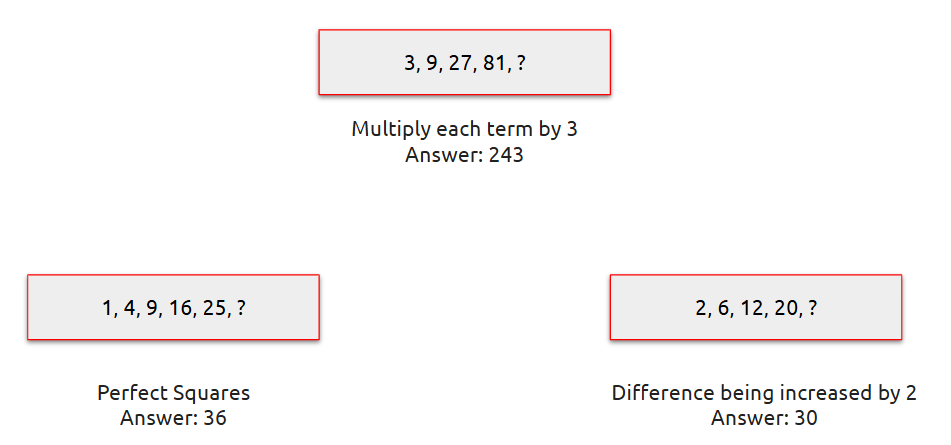
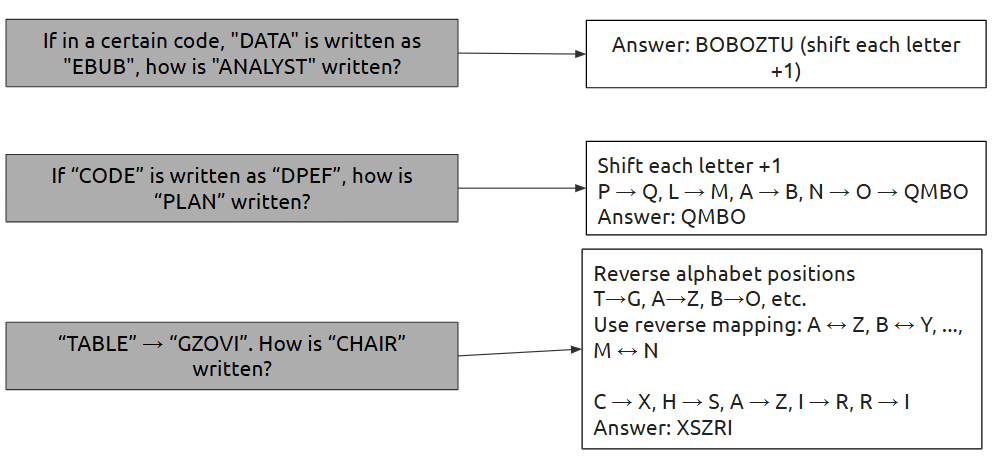
| Letter Series 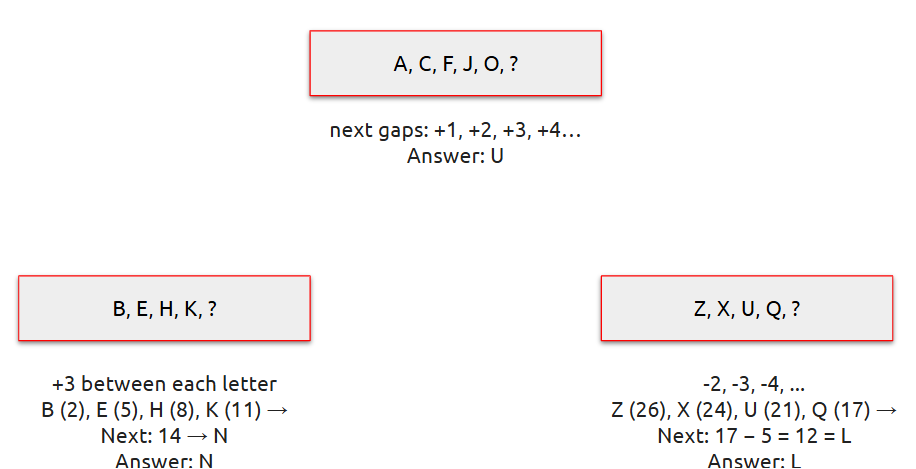
|
Code and Decode
| Syllogism
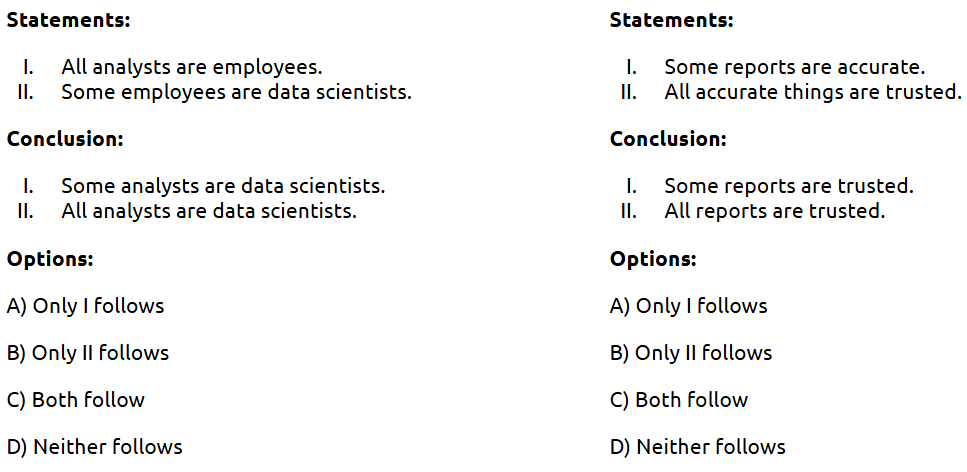
|
- Some Interview Questions
1. Q: What is a window function in SQL?
A: A function that performs calculations across rows related to the current row (e.g., ROW_NUMBER(), RANK()).
2. Q: What is the use of WITH clause (CTE) in SQL?
A: It defines a temporary result set to improve readability and reusability in complex queries.
3. Q: Difference between RANK() and DENSE_RANK()?
A: RANK() skips numbers after ties; DENSE_RANK() doesn’t.
4. Q: What is a What-If parameter in Power BI?
A: It allows users to simulate different scenarios by dynamically changing input values to see their effect on measures.
5. Q: How is DirectQuery different from Import mode?
A: Import stores data in Power BI; DirectQuery queries the source live—best for real-time data but slower performance.
6. Q: When would you use CALCULATE() in Power BI?
A: To change the context of a measure, e.g., calculating sales for a specific region:
CALCULATE(SUM(Sales[Amount]), Region="East")
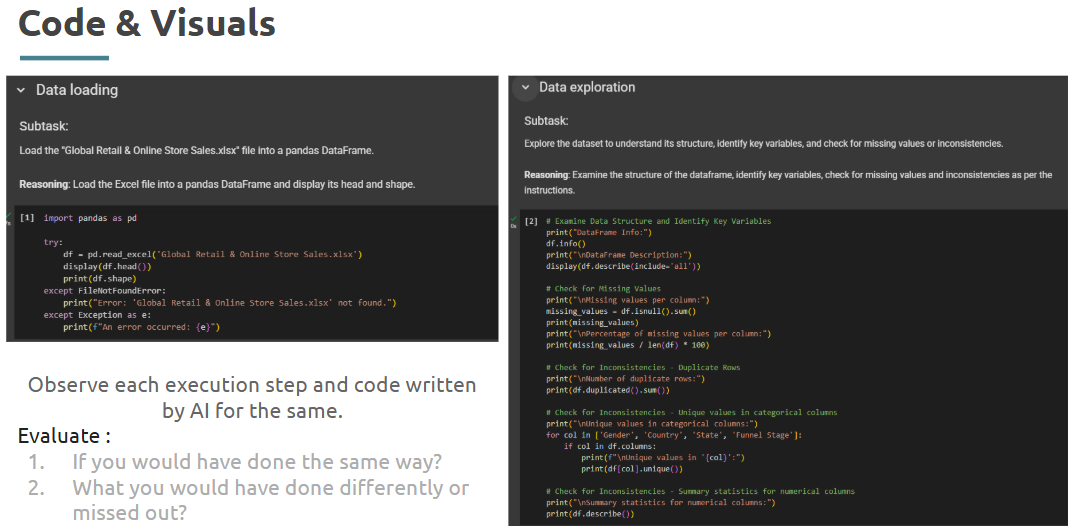
7. Q: What is the use of Google Colab in data analysis?
A: It's a cloud-based notebook that supports Python—used for writing, running, and sharing code without setup.
8. Q: How is SQL Workbench used in projects?
A: For writing, testing, and executing SQL queries—commonly used in data transformation and retrieval tasks. |
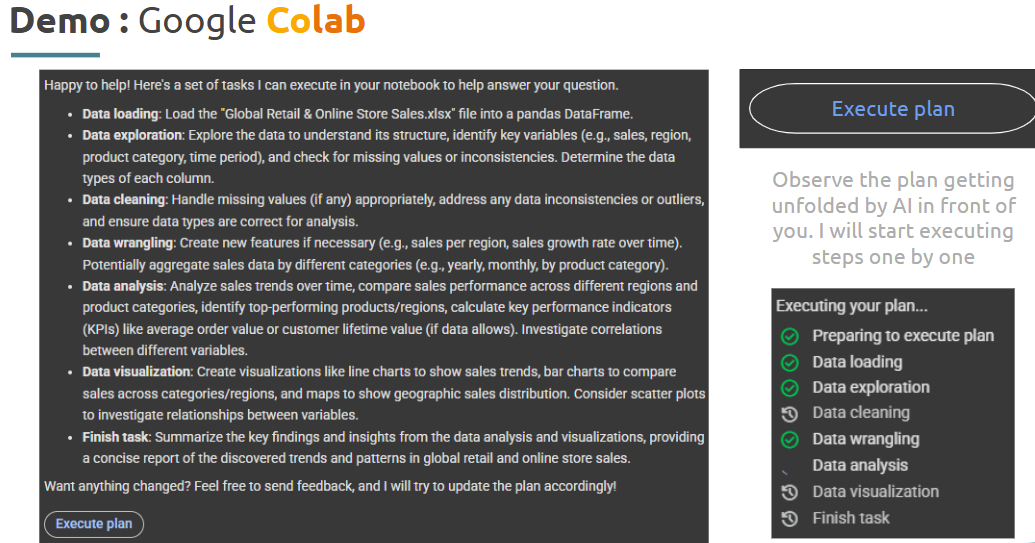
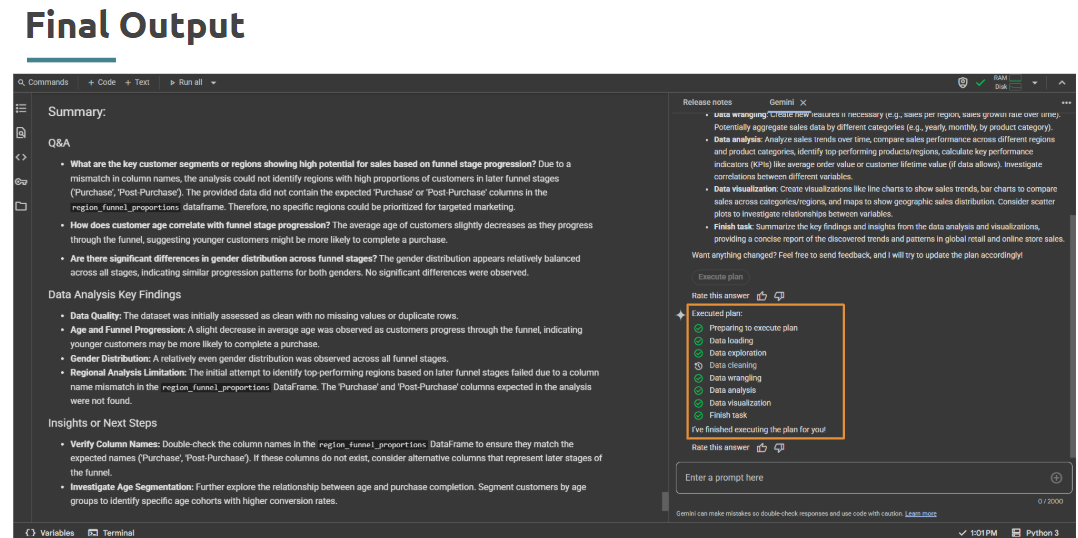
Artificial Intelligence (AI) is reshaping data analytics by automating insights, simplifying data preparation, and enabling predictive capabilities. This session introduces the use of AI tools that help analysts work faster and smarter.
What is it?
AI tools for analysis include platforms and features that apply machine learning, natural language processing, and automation to analyze data and extract patterns with minimal manual effort.
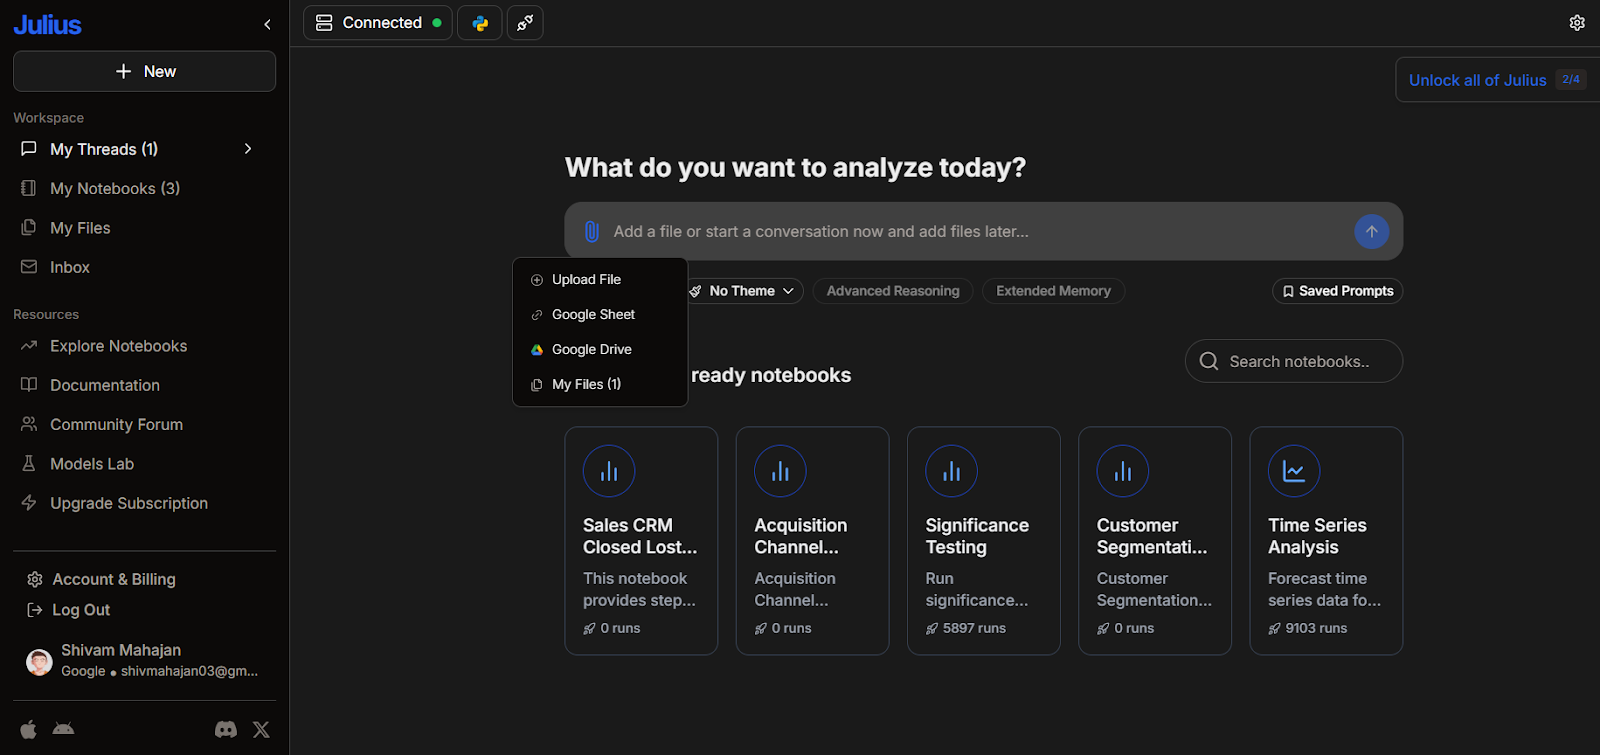
AI tools for analysis Julius Perplexity Labs Google Colab
|
How to use them ?
Julius Let’s further our cause by using different tools for different purposes!
Use same Dataset - Global Retail & Online Store Sales.xlsx Open Julius & login using your email address. Attach the file and ask - “Create a workflow for: Identify customer segments with high return rates.”
|
|
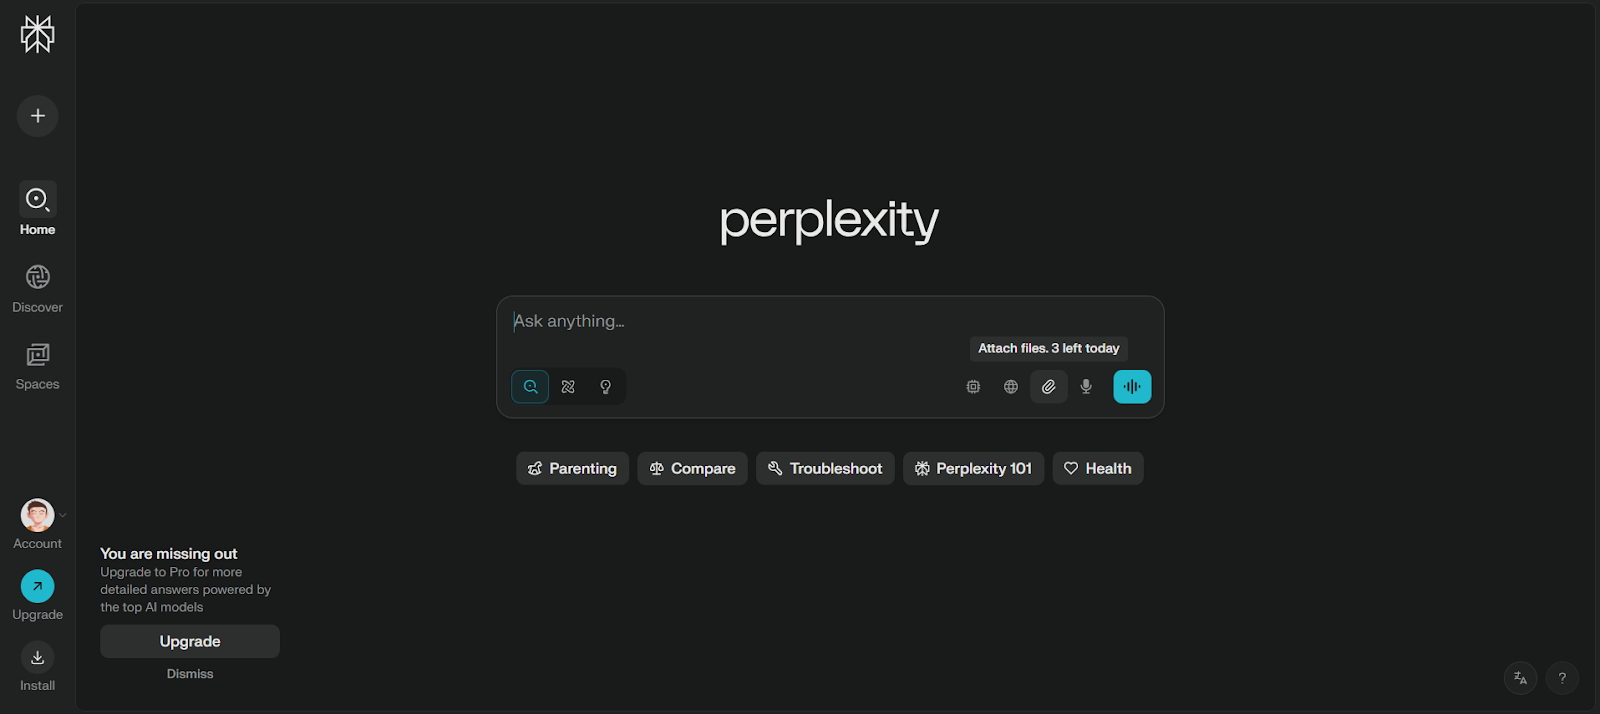
Perplexity Labs Let’s use our Global Retail Sales data from our one of the previous sprints & try to identify trends directly using AI tools.
Download Dataset - Global Retail & Online Store Sales.xlsx Open Perplexity Labs & login using your email address. Attach the file and ask - “Referencing the attached file - What were the major trends in global retail sales during 2024?”
|
|
Takeaways / Best Practices
• Combine human intuition with AI-powered suggestions for the best outcomes
• Always review AI-generated outputs for accuracy and context
• Use AI to speed up repetitive tasks like data cleaning or formatting
• Prompt engineering is critical—be clear and specific with your instructions
-Interview Prep : Data Analyst Roles
Example: What is the difference between Data Mining and Data profiling?
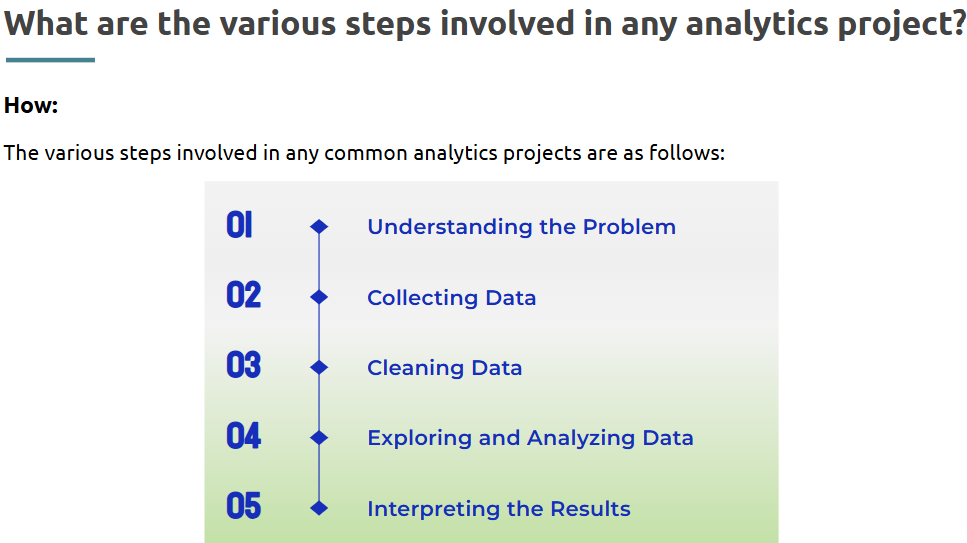
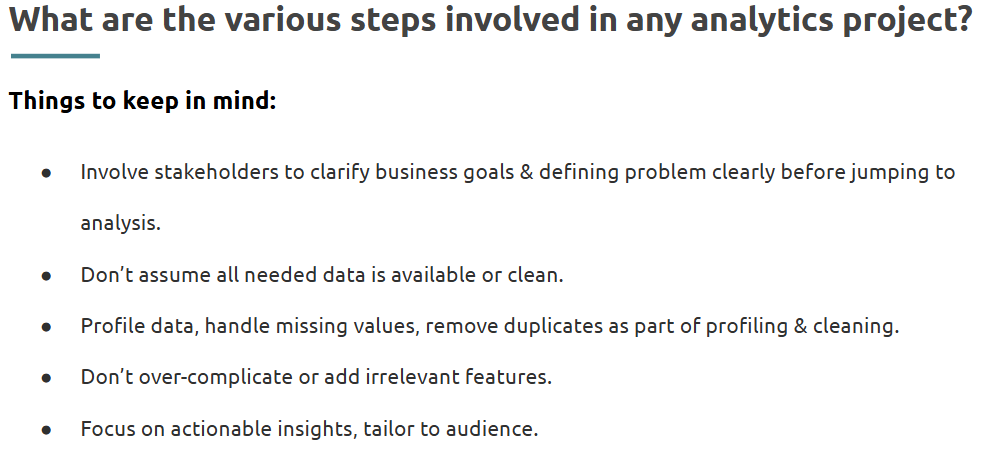
Example: What are the various steps involved in any analytics project?
Example: What is the significance of Exploratory Data Analysis (EDA)?
|
Type 1:
Note:
Intro line - (What are both of these used for / how are they similar)
3 Points compared and contrasted - |
Data Mining and Data profiling?
UseCase / Similarity: Both are essential steps in preparing and understanding data before it is used for decision-making or machine learning. Data Mining = "What can we learn from this data?" Data Profiling = "What does this data look like and is it usable?"
|
3 points compared and contrasted:
Feature | Data Mining | Data Profiling | Scope | Broad and analytical – focuses on predictive modeling and pattern discovery. | Narrow and descriptive – focuses on understanding the current state of data. | Techniques Used | Clustering, classification, regression, association rules, etc. | Column profiling, structure analysis, dependency analysis, etc. | Usage Scenario | Used in business intelligence, marketing, fraud detection. | Used in data cleaning, data migration, ETL processes. |
|
Type 2:
How, if possible, otherwise why not -
2 Things to keep in mind while doing so - (best practice/pitfalls) |
Type 3:
Need - (Give a real world deficit.) What is it? & How is it used? (fulfill the NEED section.) |
What is the significance of Exploratory Data Analysis (EDA)?
Need Before jumping into modeling or drawing conclusions, it's crucial to understand the data you’re working with. Raw data often contains: EDA reduces risk and increases model effectiveness by laying a strong foundation.
|
What is it? Exploratory Data Analysis (EDA) is the initial process of analyzing data sets to: Summarize their main characteristics Discover patterns and relationships Detect anomalies Test hypotheses using statistical graphics and data visualization
It combines statistics, visualization, and domain knowledge to extract insights before applying machine learning or advanced models.
|
How is it used? Exploratory Data Analysis (EDA) is the initial process of analyzing data sets to: Summarize their main characteristics Discover patterns and relationships Detect anomalies Test hypotheses using statistical graphics and data visualization
It combines statistics, visualization, and domain knowledge to extract insights before applying machine learning or advanced models.
|
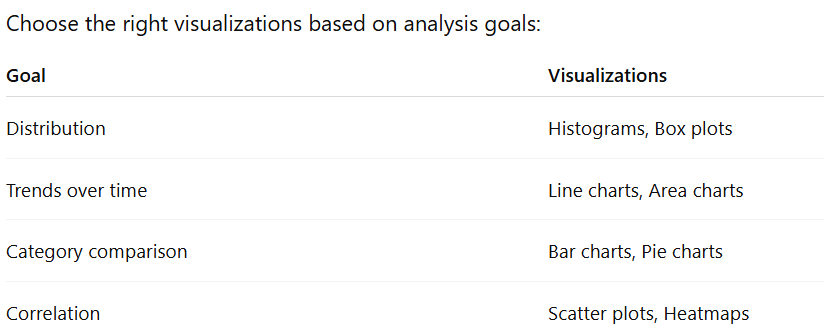
How does data visualization help you?
Data visualization has grown rapidly in popularity due to its ease of viewing and understanding complex data in the form of charts and graphs. In addition to providing data in a format that is easier to understand, it highlights trends and outliers. The best visualizations illuminate meaningful information while removing noise from data. |
What do you mean by Time Series Analysis? Where is it used?
In the field of Time Series Analysis (TSA), a sequence of data points is analyzed over an interval of time. Instead of just recording the data points intermittently or randomly, analysts record data points at regular intervals over a period of time in the TSA. It can be done in two different ways: in the frequency and time domains. As TSA has a broad scope of application, it can be used in a variety of fields. TSA plays a vital role in the following places: Statistics Signal processing Econometrics Weather forecasting Earthquake prediction Astronomy Applied science
|